Generation of a new Greenland Ice Sheet Digital Elevation Model
Project team: B. Csatho, S. Nagarajan T. Schenk, G. Babonis, University at Buffalo, Dept. of Geology; T. Scambos, B. Raup, T. Harran, NSIDC; Kurt Kjaer, Niels Koorsgard, Geological Museum/Copenhagen University; William Krabill, NASA/GSFC; Serdar Manizade, EG&G
OBJECTIVES:
- Mapping Greenland Ice Sheet boundary and coastline: A 1:2,500,000 scale data set, which includes the boundary of ice-covered regions (ice sheet, ice cap and alpine glaciers) as well as the Greenland coastline is acquired from Kort & Matrikelstyrelsens (KMS), Denmark. This data set is currently being edited and updated to reflect 2007 conditions and for reducing planimetric errors.
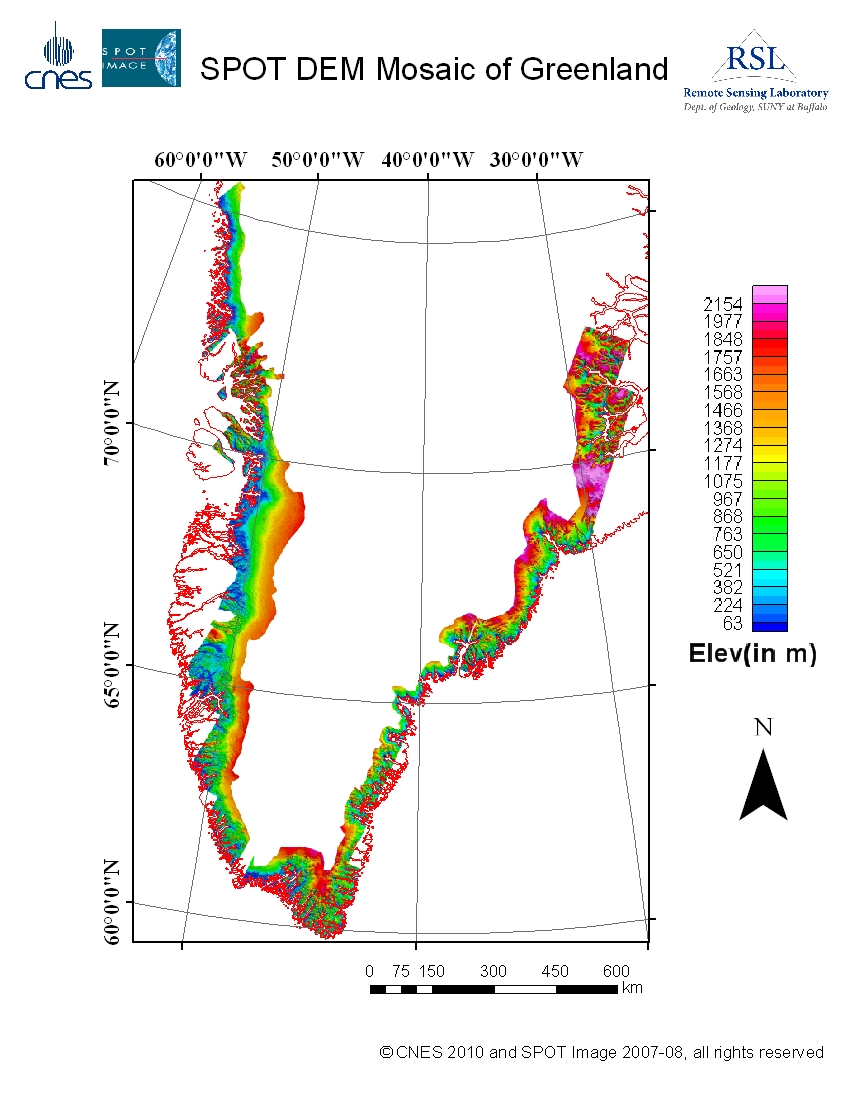
- Generation of a high resolution (40 meter) DEM mosaic of ice marginal regions and ice-free land from all individual SPOT scenes of SPIRIT (SPOT 5 stereoscopic survey of Polar Ice: Reference Images and Topographies) project of CNES-SPOT (Korona et al., 2009). DEMs derived from ASTER stereo imagery (Abrams, 2000, Slater et al., 2011) are combined with DEMs from stereo aerial photogrammetry (over ice-free areas, Kjær et al., 2010) in N Greenland where DEMs from SPIRIT SPOT images are not available. Also, ASTER and aerial photo DEMs are used to replace SPOT elevations in regions where cloud cover caused large elevation errors in the SPOT DEMs.
- Generation of a lower resolution DEM over the higher, featureless region of the ice sheet by merging elevations measured by airborne and satellite laser (ICESat, ATM) altimetry and satellite radar altimetry with a DEM derived from optical satellite imagery by photoclinometry (AVHRR -- Scambos and Harran (2002)), MODIS - is currently being developed). All elevations data are transformed to a common reference time using an ice sheet surface change history derived from laser altimetry (Csatho et al., 2010).
- Combinations of the DEMs into a multiresolution DEM of the whole ice sheet.
Results: 1. High resolution DEM mosaic from SPIRIT SPOT DEMs (S. Nagarajan and B. Csatho)
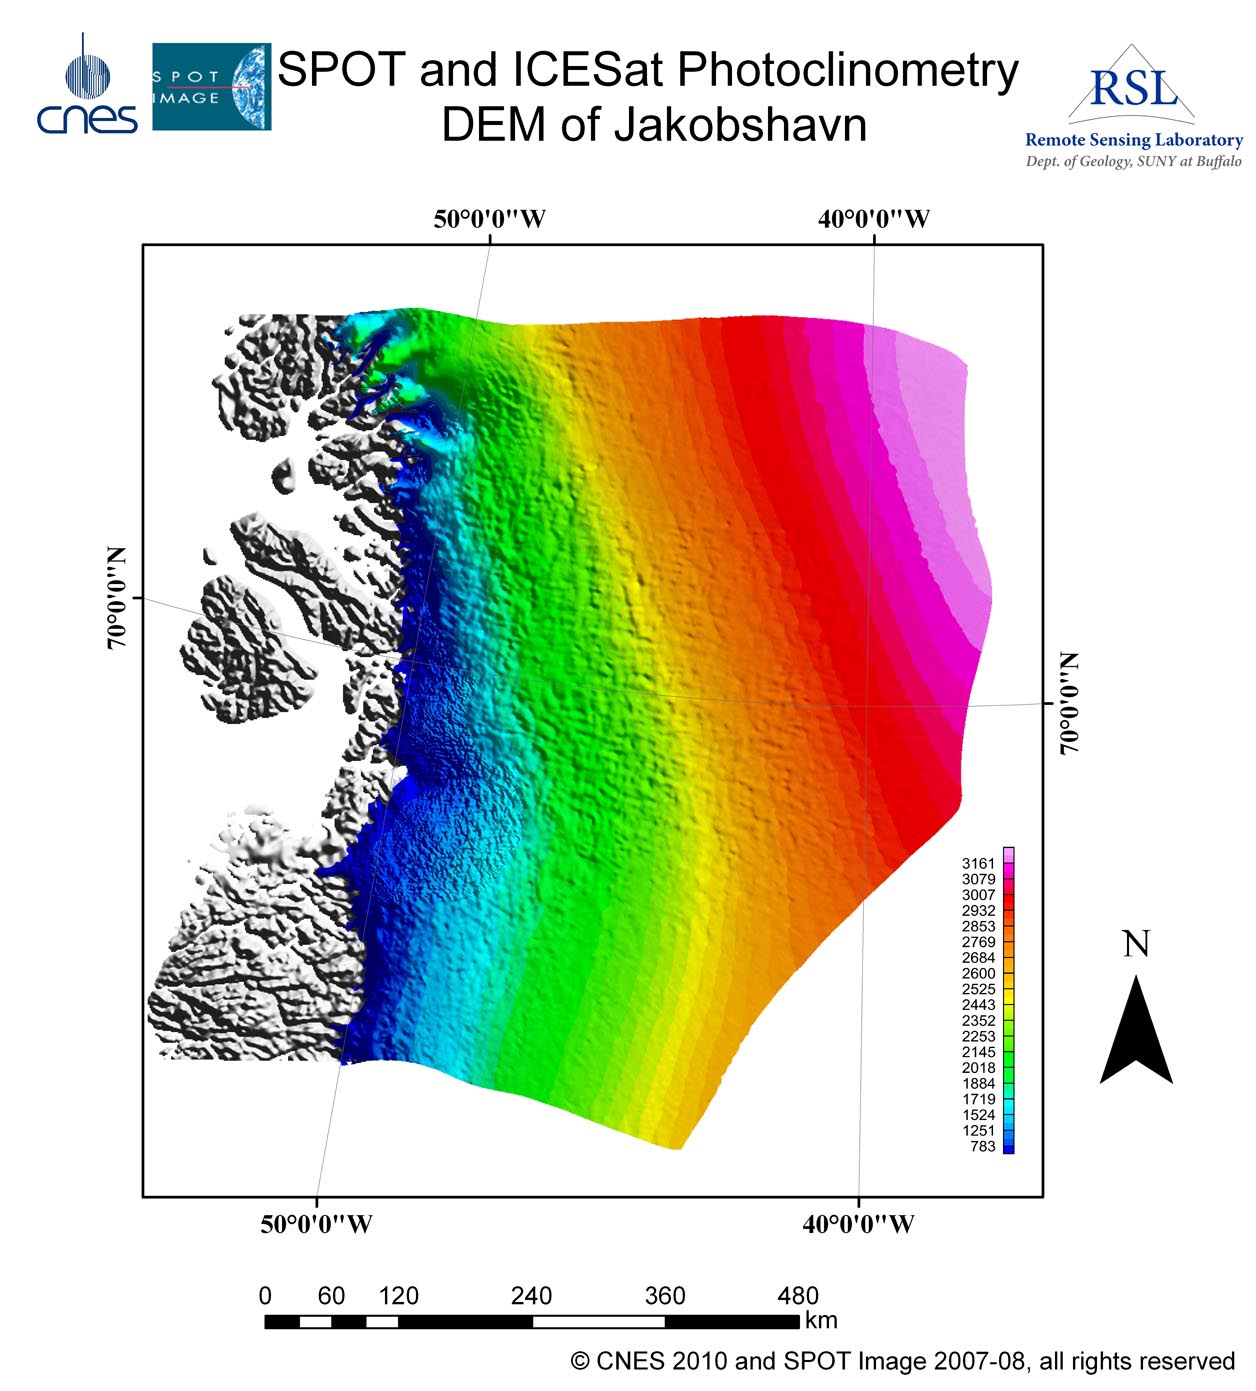
2. Fusion of SPIRIT SPOT DEM mosaic (low elevation) and ICESat-photoclinometry DEM (high elevation)

|
| DEM of Jakobshavn drainage basin created by fusing SPIRIT SPOT and ICESat/photoclinometry DEMs. |
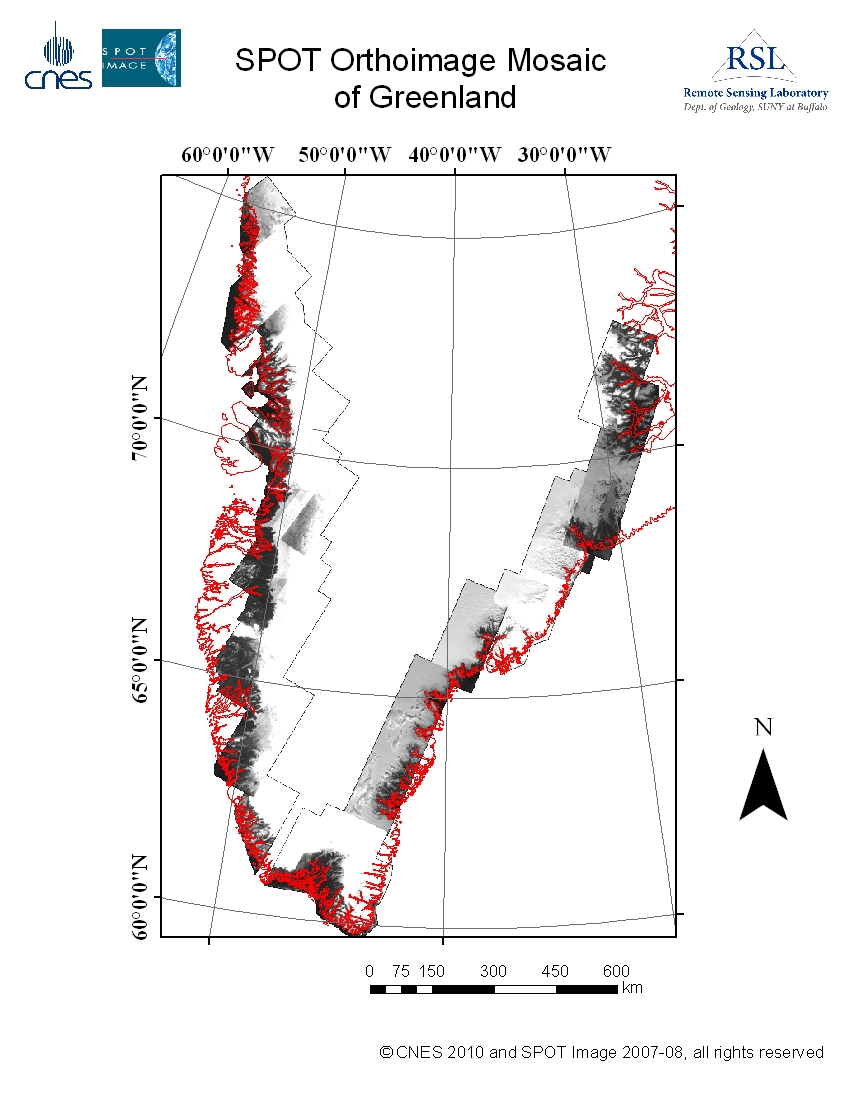
DEM and orthophoto mosaics were generated by Sudhagar Nagarajan and Bea Csatho using ERDAS IMAGINE 2011
(ERDAS), Oasis (Geosoft), ArcGIS (ESRI), ENVI (ITTVIS) and Matlab (Mathworks). SPOT images were acquired and DEMs and
orthoimages were created for each individual scene by CNES-SPOT Image as part of the SPOT 5 steroscopic
survey of Polar Ice: Reference Images and Topographies (SPIRIT) project, a contribution to the International Polar Year
(Korona et al., 2009). UB-GrIS DEM mosaic was generated by mosaicking selected individual SPOT DEMs.
Error of individual SPOT DEMs were caused by failed image matching over the featureless high elevation part of the ice
sheet and in areas covered by clouds. Correlation masks provided by SPOT, visual inspection of shaded relief DEMs and
orthoimages as well as precise airborne and satellite laser altimetry data were used to detect and remove regions with
large elevation error from the mosaicked data set.
The ICESat/photoclinometry DEM was created by fusing the photoclinometry DEM of Scambos and Harran (2002)
and satellite and airborne laser altimetry data acquired by NASA's ICESat and ATM systems (Csatho and Schenk, 2008).

